Tuesday, February 17, 2015
Stat Pack: Magic Numbers
A look at key numbers as conference races near their conclusion.

In our Stat Pack feature, College Hockey Inc. highlights five obscure but telling statistics from the world of college hockey.
1. Three conferences are down to the final two weeks of their regular seasons, and the championship contenders in the WCHA have only two weeks left (the Big Ten has four weeks left; the NCHC has three). A team’s “magic number” counts how many points that team would need to gain – or a pursuing team would have to lose – for that team to clinch the championship. The following look at what teams would need to win their conferences outright:
Atlantic Hockey: Robert Morris has a magic number of 2 points vs. Bentley and 2 points vs. Mercyurst
ECAC Hockey: Quinnipiac has a magic number of 2 points vs. St. Lawrence
Hockey East: Boston University has a magic number of 3 points vs. Boston College
WCHA: Minnesota State has a magic number of 8 points vs. Michigan Tech (with a series between the two teams next weekend, Feb. 27-28)
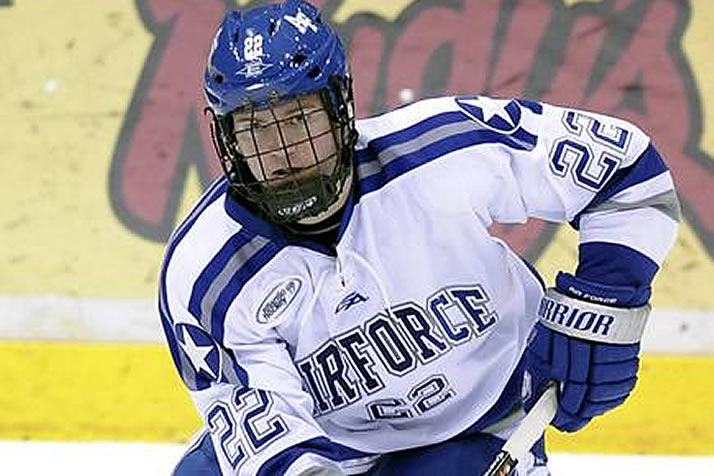
2. Air Force senior Cole Gunner (Richfield, Minn./Tri-City-USHL) ranks tied for 17th nationally in points, but no player has points in as many games as he does:
Most Games with a Point (Pct. of all games)
25 – Cole Gunner, Air Force (75.8%)
23 – Jimmy Vesey, Harvard (95.8%) (NSH)
23 – Tanner Kero, Michigan Tech (71.9%)
22 – Jack Eichel, Boston University (81.5%)
22 – Matt Garbowsky, RIT (73.3%)
22 – Austin Orszulak, AIC (68.8%)
22 – Chad Demers, Air Force (66.7%)
3. Here’s a look at the teams most likely to score – or allow – a shorthanded goal:
Most Shorthanded Goals
9 – North Dakota
7 – Massachusetts
7 – UMass Lowell
7 – Minnesota Duluth
7 – St. Lawrence
7 – Union
Most Shorthanded Goals Allowed
8 – Bemidji State
6 – Air Force
6 – Alabama Huntsville
6 – Connecticut
6 – Minnesota State
4. When looking at certain statistics – like blocked shots or faceoffs – looking just at games away from home can sometimes give a more accurate look at a team’s performance. With that in mind, here are the top teams in blocked shots, just in games away from home:
Most Blocked Shots per Game (Away/Neutral Only)
18.50 – Dartmouth
18.14 – Harvard
17.71 – Robert Morris
16.95 – Connecticut
16.53 – Ohio State
16.00 – Holy Cross
15.88 – New Hampshire
15.29 – Niagara
15.29 – Penn State
15.07 – Michigan State
5. St. Lawrence freshman Kyle Hayton (Denver, Colo./Sioux City-USHL) has been one of the best goaltenders in the country, in part because of his dominance in the first period, when he has allowed only 7 goals in 29 games.
Best Save Percentage, First Period
.974 – Kyle Hayton, St. Lawrence
.957 – Terry Shafer, Robert Morris
.955 – Matt Morris, Maine
.951 – Dalton Izyk, Robert Morris
.950 – Zane McIntyre, North Dakota (BOS)
.949 – Keegan Asmundson, Canisius
.947 – Alex Vazzano, Sacred Heart
.946 – Jamie Phillips, Michigan Tech (WPG)
.946 – Gordon Defiel, Lake Superior State
.945 – Michael Bitzer, Bemidji State
